Automate Candlestick formations
Welcome to Episode 27 of Trading Talk.
Candlestick charting is a widely used method by traders for analyzing and interpreting price movements in financial markets. It involves using a type of chart that represents the price movement of an asset over a specific time period through a series of candlestick formations. Each formation represents the opening, closing, high, and low prices for that period.
Traders use several candlestick patterns to analyze price movements and spot potential trading opportunities. Some of the most common patterns include:
- Bullish engulfing pattern: This pattern signals a bullish trend when a small red candlestick is followed by a larger green candlestick that completely engulfs the previous candlestick.
- Bearish engulfing pattern: This pattern signals a bearish trend when a small green candlestick is followed by a larger red candlestick that completely engulfs the previous candlestick.
- Hammer pattern: This pattern indicates a bullish trend when a small green candlestick has a long lower shadow and a small upper shadow, with a small body near the top.
- Shooting star pattern: This pattern indicates a bearish trend when a small red candlestick has a long upper shadow and a small lower shadow, with a small body near the bottom.
- Doji pattern: This pattern suggests market indecision when the opening and closing prices for a period are the same.
Access Candlestick Pattern Recognition Software and skip straight to the good part.
Traders also use candlestick trading strategies to make decisions based on the patterns they observe. Some popular strategies include:
- Trend trading strategy: Identifying the trend and looking for patterns that confirm it.
- Reversal trading strategy: Looking for patterns that suggest a trend reversal is about to occur.
- Breakout trading strategy: Looking for patterns that suggest a breakout is about to happen.
- Support and resistance trading strategy: Looking for patterns that occur near key support or resistance levels.
By understanding candlestick patterns and applying appropriate trading strategies, traders can increase their chances of success in financial markets.
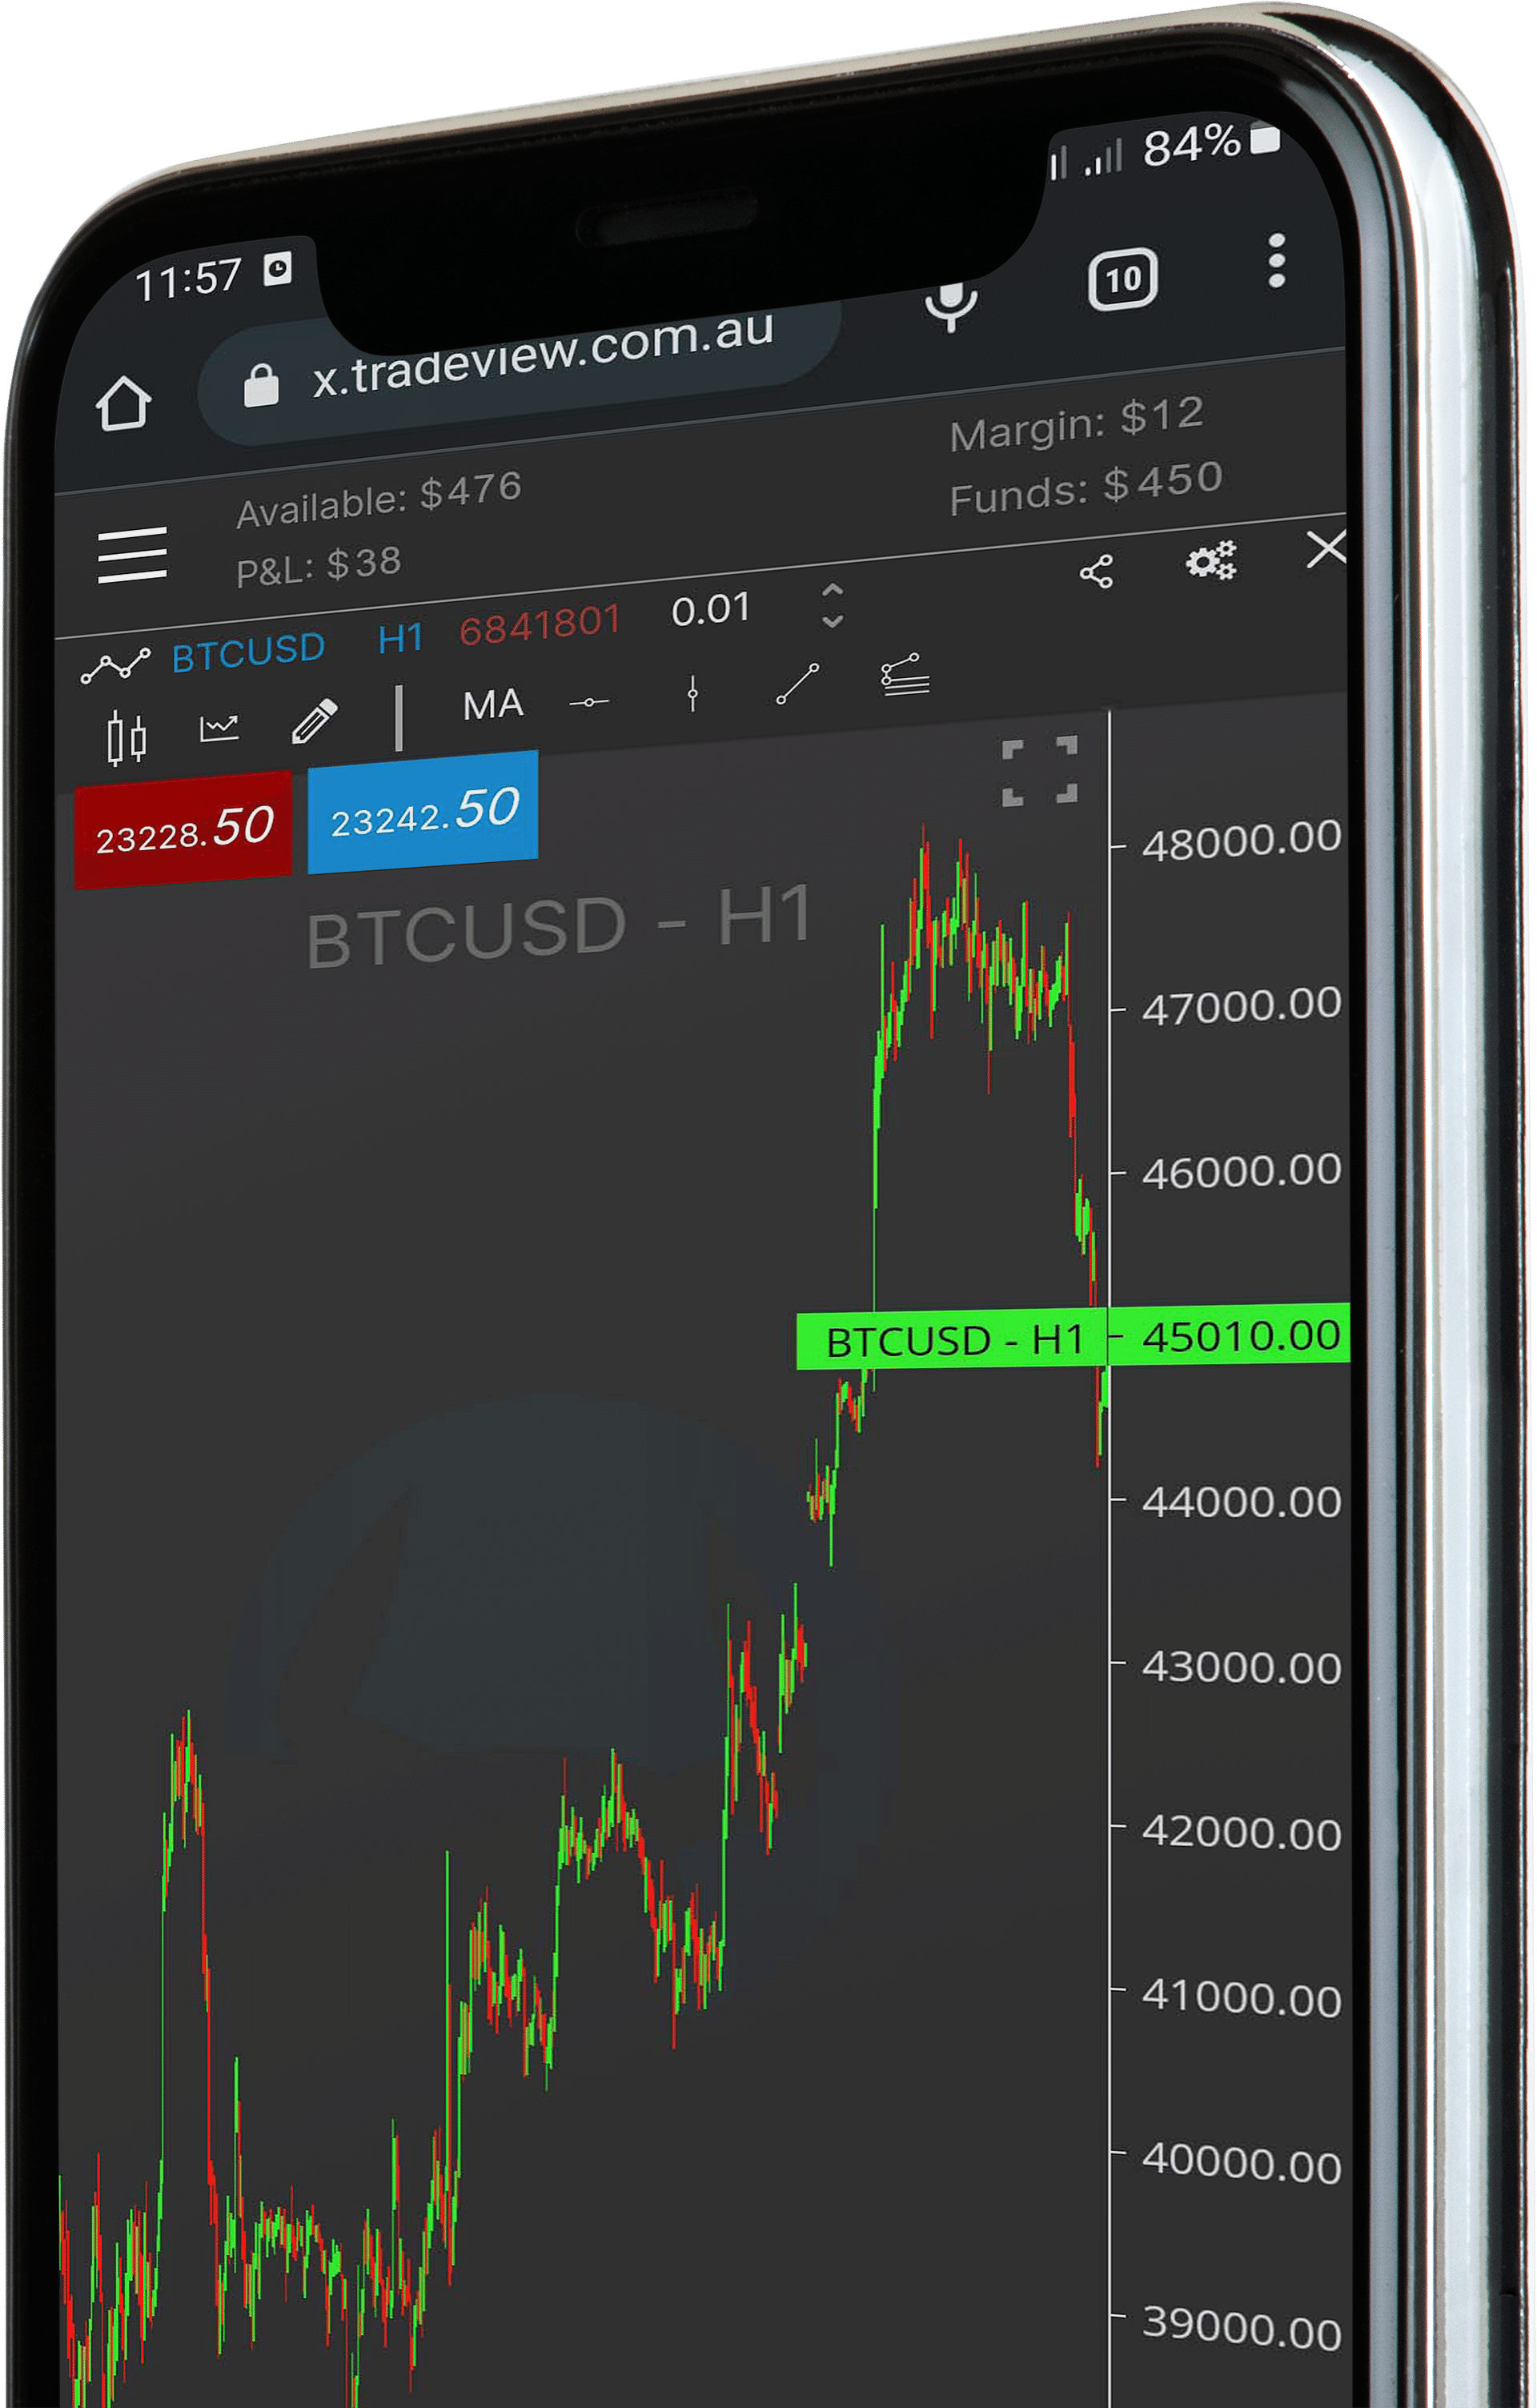
In this episode, we show you how to define a pin bar and some other candlestick patterns, then continue to build them using functions in Trade View X.
You can then use these a single block and simply combine multiple patterns to suit your trading.
To see all the Trading Talk episodes in full check out www.tradeview.com.au/trading-talk/
Ready to start trading? Sign up with our Partner Broker www.tradeview.tech


